Linear Analysis of Calibration Using PYEMU
This example demonstrates a linear analysis of the Calibration Using LMFIT example using the pyemu module (https://github.com/jtwhite79/pyemu). Singular values from pyemu’s eigenanalysis of the jacobian are plotted and identifiability of parameters are printed. The resulting identifiability values indicate that one of the parameters (amp) is significantly less identifiable than the others.
# %load calibrate_sine_lmfit_pyemu.py
%matplotlib inline
import sys,os
import matk
import numpy as np
from matplotlib import pyplot as plt
from multiprocessing import freeze_support
sys.path.append('/Users/dharp/source-mac/pyemu')
import pyemu
from mat_handler import matrix,cov
# define objective function: returns the array to be minimized
def sine_decay(params, x, data):
""" model decaying sine wave, subtract data"""
amp = params['amp']
shift = params['shift']
omega = params['omega']
decay = params['decay']
model = amp * np.sin(x * omega + shift) * np.exp(-x*x*decay)
obsnames = ['obs'+str(i) for i in range(1,len(data)+1)]
return dict(zip(obsnames,model))
# create data to be fitted
x = np.linspace(0, 15, 301)
np.random.seed(1000)
data = (5. * np.sin(2 * x - 0.1) * np.exp(-x*x*0.025) +
np.random.normal(size=len(x), scale=0.2) )
# Create MATK object
p = matk.matk(model=sine_decay, model_args=(x,data,))
# Create parameters
p.add_par('amp', value=10, min=5., max=15.)
p.add_par('decay', value=0.1, min=0, max=10)
p.add_par('shift', value=0.0, min=-np.pi/2., max=np.pi/2.)
p.add_par('omega', value=3.0, min=0, max=10)
# Create observation names and set observation values
for i in range(len(data)):
p.add_obs('obs'+str(i+1), value=data[i])
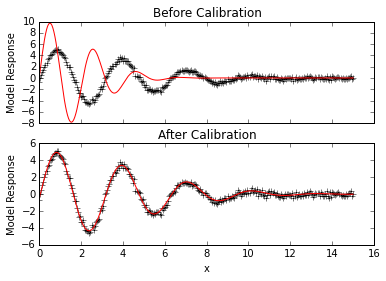
# Look at initial fit
p.forward()
f, (ax1,ax2) = plt.subplots(2,sharex=True)
ax1.plot(x,data, 'k+')
ax1.plot(x,p.simvalues, 'r')
ax1.set_ylabel("Model Response")
ax1.set_title("Before Calibration")
# Calibrate parameters to data, results are printed to screen
lm = p.lmfit(cpus=2)
# Look at calibrated fit
ax2.plot(x,data, 'k+')
ax2.plot(x,p.simvalues, 'r')
ax2.set_ylabel("Model Response")
ax2.set_xlabel("x")
ax2.set_title("After Calibration")
plt.show()
[[Variables]]
     amp:       5.011593 +/- 0.013966 (0.28%) initial =  10.000000
     decay:     0.024837 +/- 0.000231 (0.93%) initial =  0.100000
     omega:     1.999111 +/- 0.013378 (0.67%) initial =  3.000000
     shift:    -0.106200 +/- 0.016466 (15.50%) initial =  0.000000
[[Correlations]] (unreported correlations are <  0.100)
    C(omega, shift)              = -0.785
    C(amp, decay)                =  0.584
    C(amp, shift)                = -0.117
None
SSR:  12.8161392911
# Recompute jacobian at calibration point
J = p.Jac(cpus=2)

# Use pyemu module to analyze identifiability of parameters within calibration
# Create matrix object of jacobian for pyemu
m = matrix(x=J,row_names=p.obsnames,col_names=p.parnames)
# Create prior parameter covariance matrix using parameter bounds (uniform priors)
parcov_arr = np.array([((mx-mn)/4.)**2 for mx,mn in zip(p.parmaxs,p.parmins)])*np.eye(len(p.pars))
parcov = cov(parcov_arr,names=p.parnames)
# Create prior observation covariance matrix based on observation weights (p.obsweights)
# In this case, it is an identity matrix since all weights are one
obscov_arr = np.eye(len(p.obs))*p.obsweights
obscov = cov(obscov_arr,names=p.obsnames)

# Create pyemu error variance object using jacobian and parameter and observation covariances
#la = pyemu.errvar(jco=m,parcov=parcov,obscov=obscov,forecasts=['obs1'],omitted_parameters=['omega'])
la = pyemu.errvar(jco=m,parcov=parcov,obscov=obscov,forecasts=['obs1'])

# Plot the singular values from the eigenanalysis of the jacobian
s = la.qhalfx.s
plt.title("Singular spectrum")
plt.ylabel("Power")
plt.xlabel("Singular value")
plt.plot(s.x)
plt.show()

# Print identifiability of parameters
# The results indicate that 'amp' has low identifiability relative to other parameters
ident_df = la.get_identifiability_dataframe(3)
print "\nIdentifiability of parameters:"
print ident_df['ident']
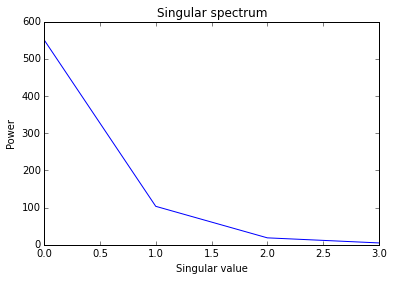
Identifiability of parameters:
amp      0.001426
decay    0.999956
shift    0.998698
omega    0.999919
Name: ident, dtype: float64